PCM-net: Phase-change material data collection
How the material data are collected
Material data can be readily obtained from published research articles.
Research articles provide the data in the form of graphical plots
(visualizations) or alternatively through supplementary datasets
(less widely available). Since the former does not directly provide
the dataset in numbers, it requires a conversion process from visual
graph plot images back to the original dataset. While a range of
chart recognition tools are available for converting graphical
images to datasets (numbers), it should be noted that the conversion
process is hard to automatize and requires manual work. For example,
WebPlotDigitizer
can generate the original dataset from a given plot
image file by extracting the plot line. WebPlotDigitizer automatizes
the process of detecting the color difference between the line and the
background, and extracts the plot line. But users still need to manually
specify the details of the plot with a mouse or a pen input device, such
as the plot line area, x-y axes, and the scale of the axes.
Extracting coordinate data from line plots using
WebPlotDigitizer
Below are the steps for using WebPlotDigitizer to extract the desired
x-y coordinate values for a line plot. Figure describes how users
extract a characteristic dataset for a PCM from a plot image using
WebPlotDigitizer.
Using WebPlotDigitizer to extract the data
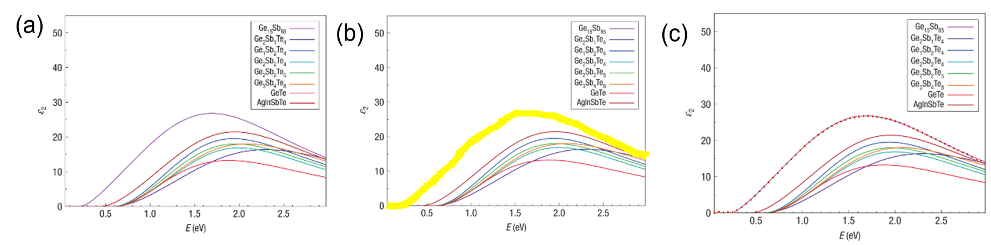
Figure 1. Extracting x-y coordinates data from a line plot.
Below are the steps for using WebPlotDigitizer to extract the
desired x-y coordinate values for a line plot. Figure 1 describes how
users extract a characteristic dataset for a PCM from a plot image using
WebPlotDigitizer.
- Upload the plot image file to WebPlotDigitizer: Crop the
plot image file (Figure 1(a)) from the paper and upload it to the
WebPlotDigitizer web application
- Set up the basic axis scale information. In this example,
wavelength for the x-axis has a range between 0 and 3 (eV).
Refraction index on the y-axis has a range between 0 and 55.
- Specify the plot line color and mark the plot line: WebPlotDigitizer
distinguishes the plot line from the background using the difference in
colors. In this example, the purple color of the plot line (Ge15Sb85)
is set to the foreground color. Then users need to roughly mark
the background area (denoted as yellow color in Figure 1(b)) that
WebPlotDigitizer processes for extracting the plot line with the mouse
operation.
- Data extraction and refinement: WebPlotDigitizer then extracts the plot
line with the specified foreground color and generates points on the
line to be converted into (x, y) coordinate values. From the figure,
it can be seen that red dots are generated on the purple plot line and
each dot corresponds to the (x, y) coordinate value of the extracted
plot line. WebPlotDigitizer has options available for data extraction
methods and "X step with interpolation option" is selected where
users can specify ΔX step value on the x-axis. The reason for the
option selection is that it can generate the y-axis value mapped
one-to-one for an x-axis value and the y-axis value estimation using
linear interpolation techniques can be more accurate for a curvy line
plot. In this example, when ΔX is set to 0.05, WebPlotDigizier extracts
the corresponding y coordinates for x coordinates 0, 0.05, 0.10, and so
on up to 3. In Figure 1(c), it can be seen that WebPlotDigitizer is able
to generate extracted red dots on the plot line while there seems to be
slight errors visually identifiable in the y-axis values on the left and
rightmost sides. These errors can be modified manually by clicking on
each dot and adjusting the y-axis value.
- Export the extracted (x, y) coordinate values to a file: Users can
export the extracted dataset as a comma separated values (CSV) file
format. Exported data are then stored in the MySQL database.